DViselection
The Selection of my works in Data Vis
Type
Data-vis Websites for a course named Info Visualization & Intern Work for an institute on campus named Clark Library
Time
2018.10-2018.12
My Role
DataVis Designer / Programmer
Skills
Sketch / Brainstorm / Coding
Tools
HTML / CSS / JavaScript / jQuery / D3.js
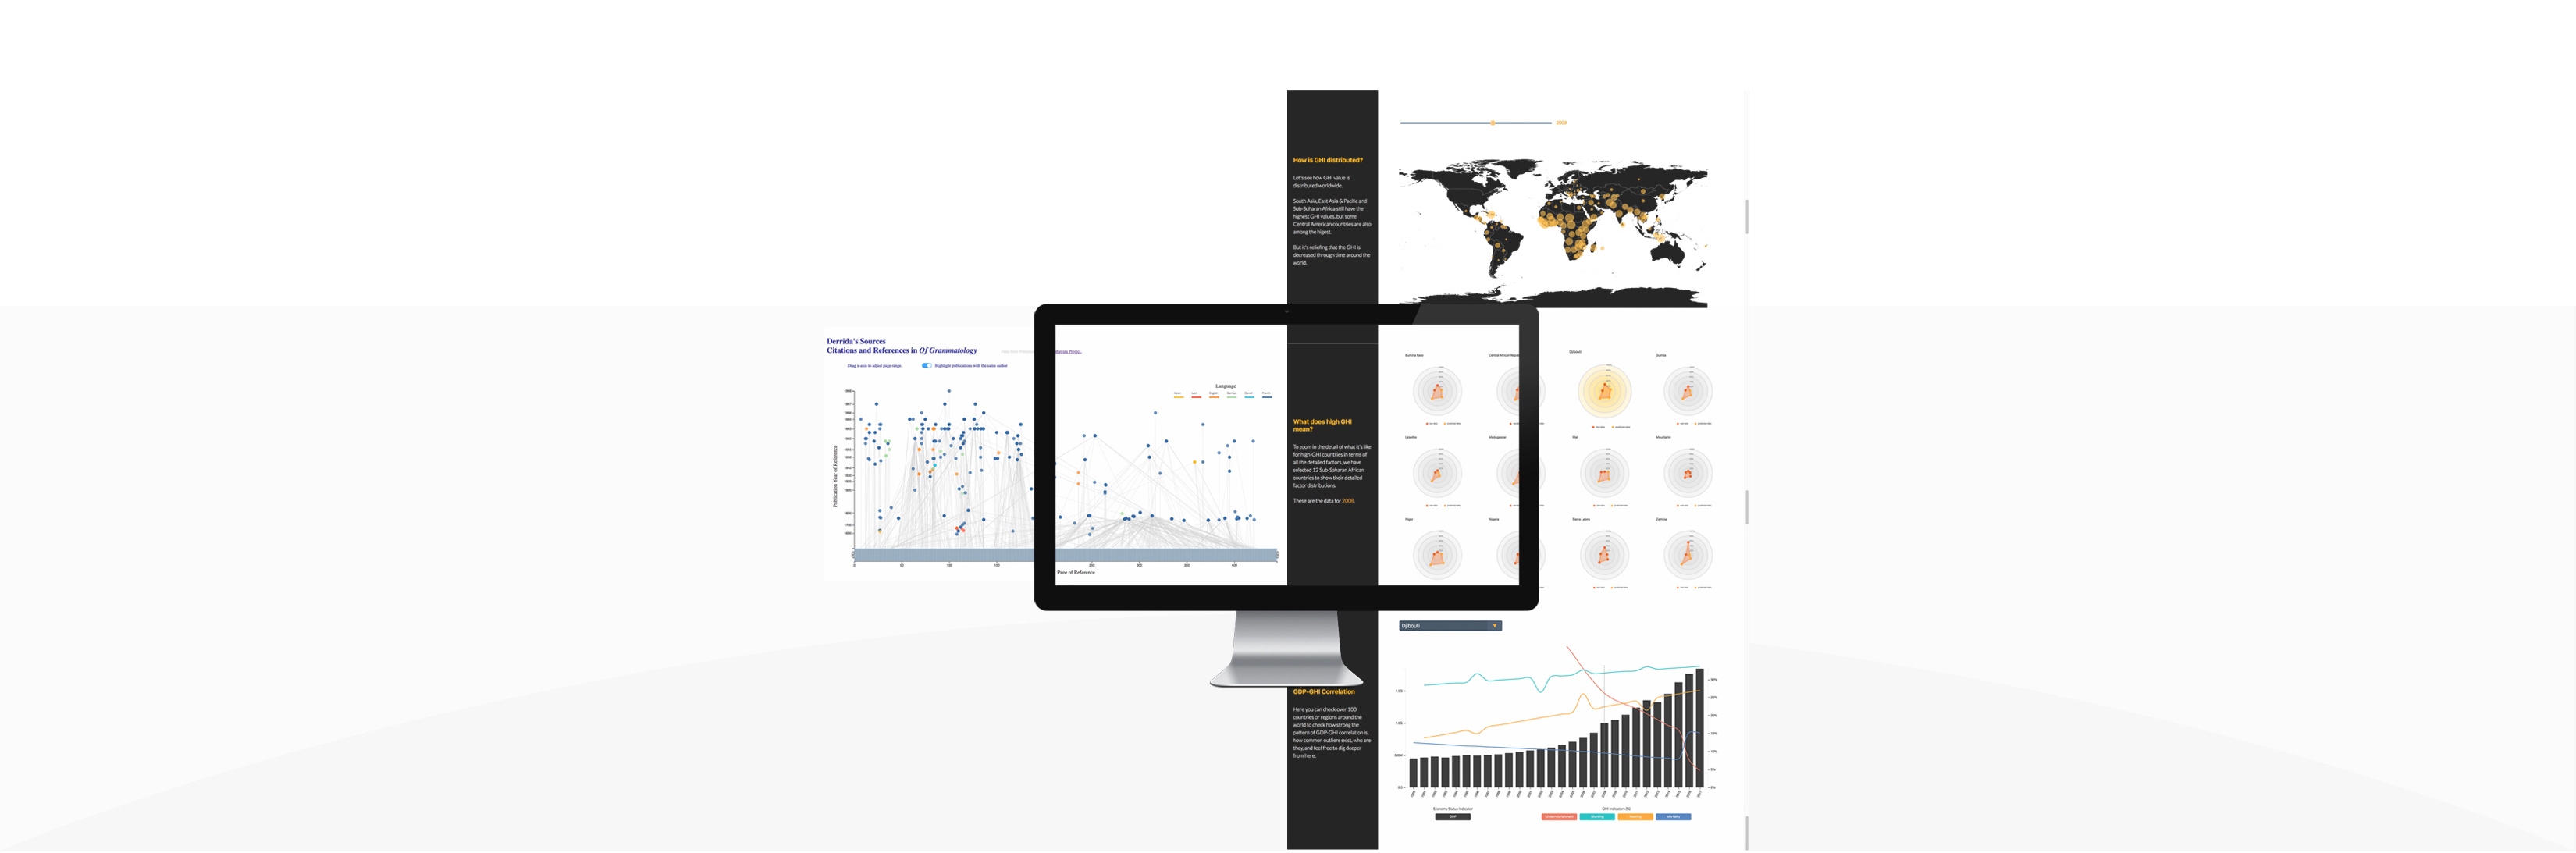
Intro to Global Hunger Index ( GHI )
Teammates Xiaochuan Kou / Guanchao Huang / Yu-Cheng Chang / Dora Weng
What I Did Sketched, designed and coded the structure of the website and its way of interaction. I also integrated the codes for different sections together.
Background
The 2018 GHI indicates that the global level of hunger and undernutrition falls to 20.9, down from 29.2 in 2000.
Underlying this improvement are the reductions in the four GHI indicators:
the ratio of undernourishment,
child stunting (too short for one’s age),
child wasting (dangerously thin for one’s height),
and child mortality.
However, some contries still suffer from hunger severely, where are they and why?
Domain Questions
What is Global Hunger Index (GHI) ?
What does its geo-distribution look like? Which regions have more serious GHI?
How are children’s stunting, wasting and mortality rate distributes for the countries with worse GHI?
Whether or not the improvement of economy status (GDP) also improves the children’s status in terms of stunting, wasting and mortality? ( Help exploring potential start point for other deeper studies)
Demo
Derrida's Sources
Teammates Justin Joque (Mentor) / Jordan Earnest (Programmer) / Hope Tambala (Programmer) / Rheagan Martin (Data Analyst) / Hannah VanWingen (Data Analyst) / Emily Lin (Data Analyst)
What I Did I mainly progammed most interactive parts of the visualization in JS.
Background
Jacques Derrida is one of the major figures of twentieth-century thought, and his library - which bears the traces of decades of close reading - represents a major intellectual archive. The Princeton University Library (PUL) houses Derrida’s Margins, a website and online research tool for the annotations of Jacques Derrida. We used data collected from this project to create visualizations of the references used throughout Derrida’s De la grammatologie.
Domain Questions
How are the references distributed throughout the book?
When was each reference source published?
Who wrote each reference? And are there multiple references written by one author?
What language was each reference written in?
Demo
TAKEAWAY
-
Objective First. When came to Data Vis, I was inclined to pursue fancy effect at the first place, but in practice, it is the goal that should be focused on before anything else.
-
Always Push to Guihub. I co-coded the projects with my teammates. Through the process, I became more and more confident in resolving code conflicts, and I came to undestand and believe push/pull frenquently is fundamental for cooperations in programming.