About Neil

Problem Solver

Team Member

Quick Learner

ARCHITECTURE (DESIGN THROUGH DIAGRAMMING)
I analyze through diagramming to generate the design
I seeked inspiration by representing how the ancient town is percieved.

I diagrammed the map differently to identify constraints and define opportunities.
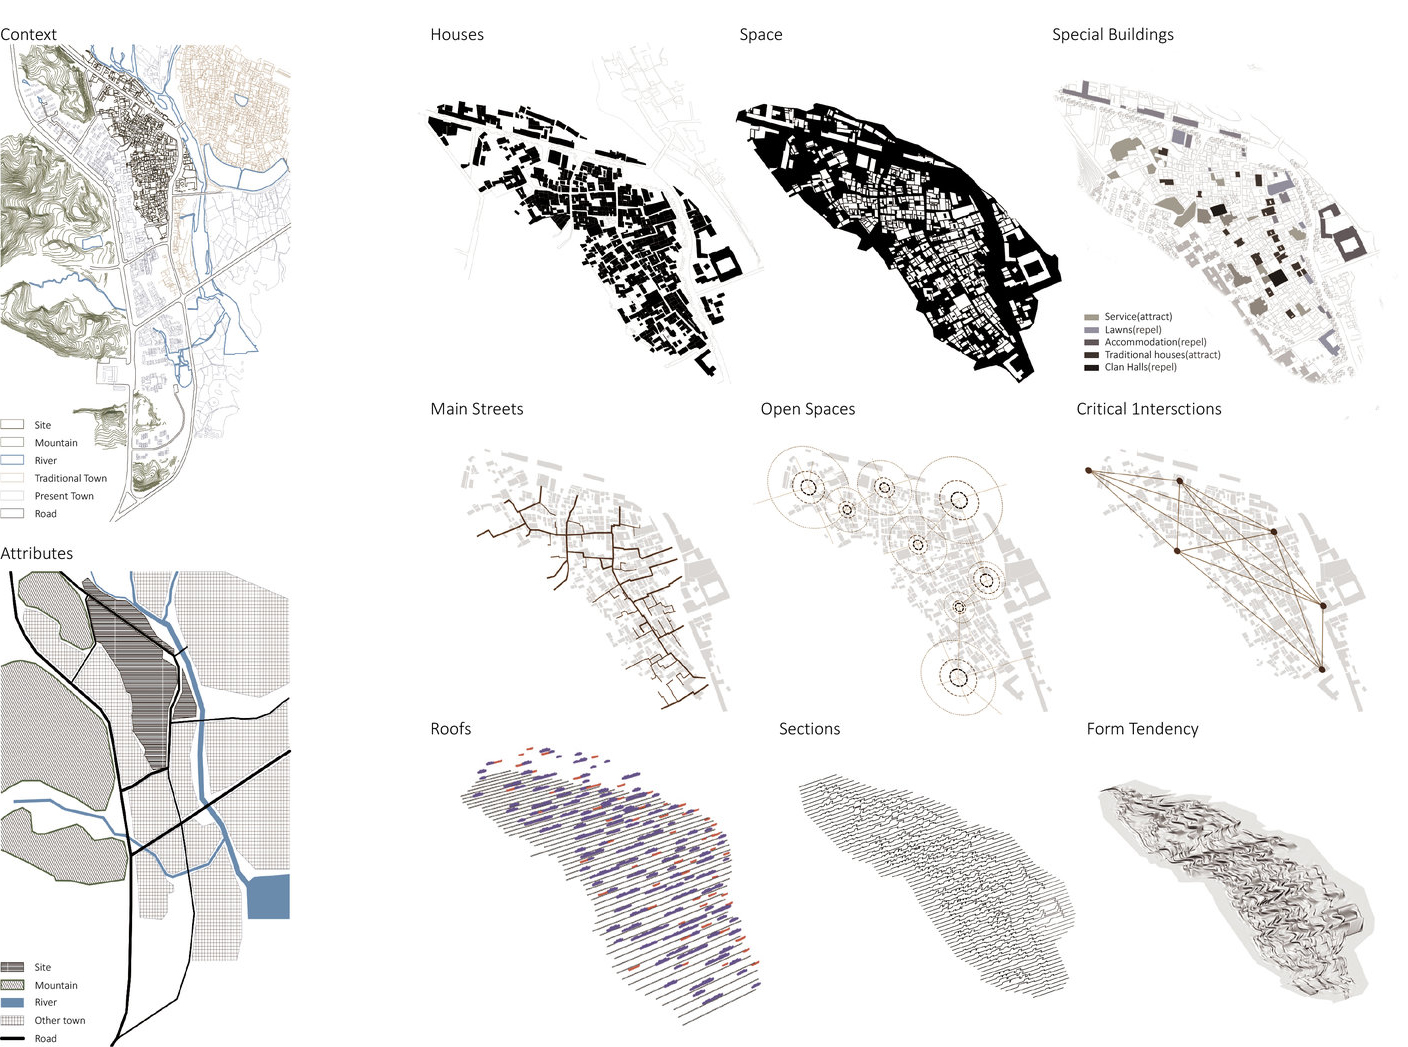
Through research on the locals and travelers, I diagrammed their activity patterns
to further seek design opportunities.


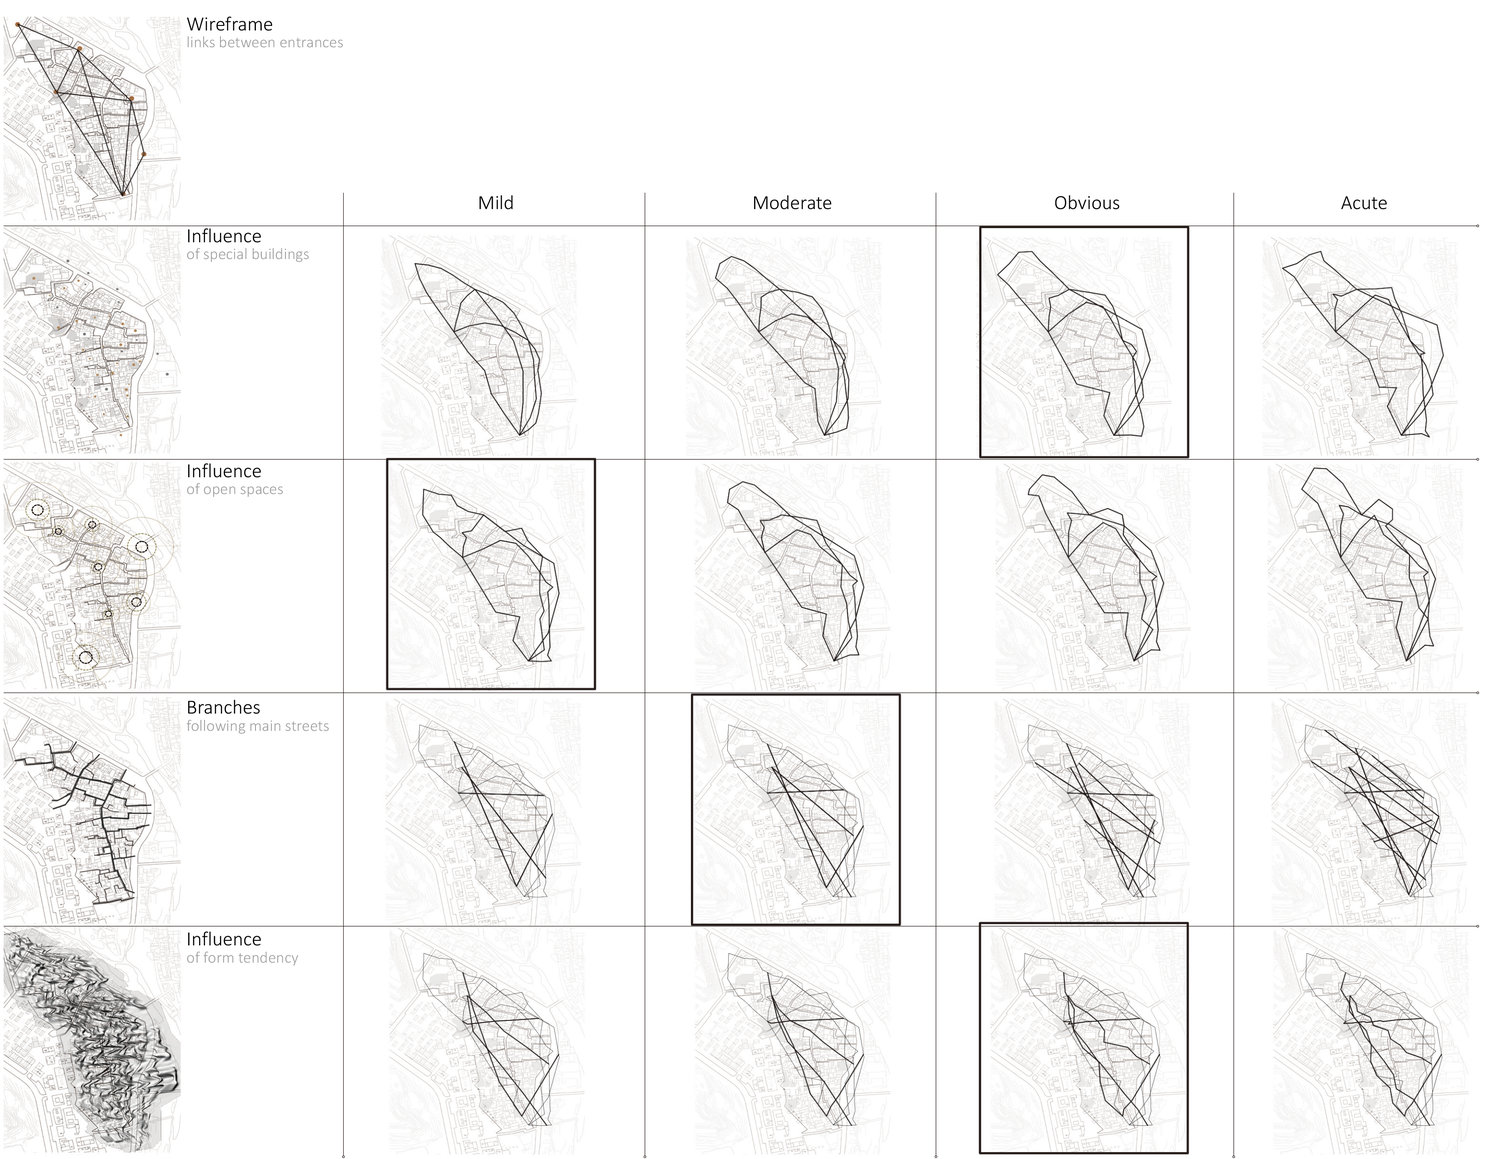
I coded to generate the design for a skywalk route, and I iterated to find the
optimal set of parameters.
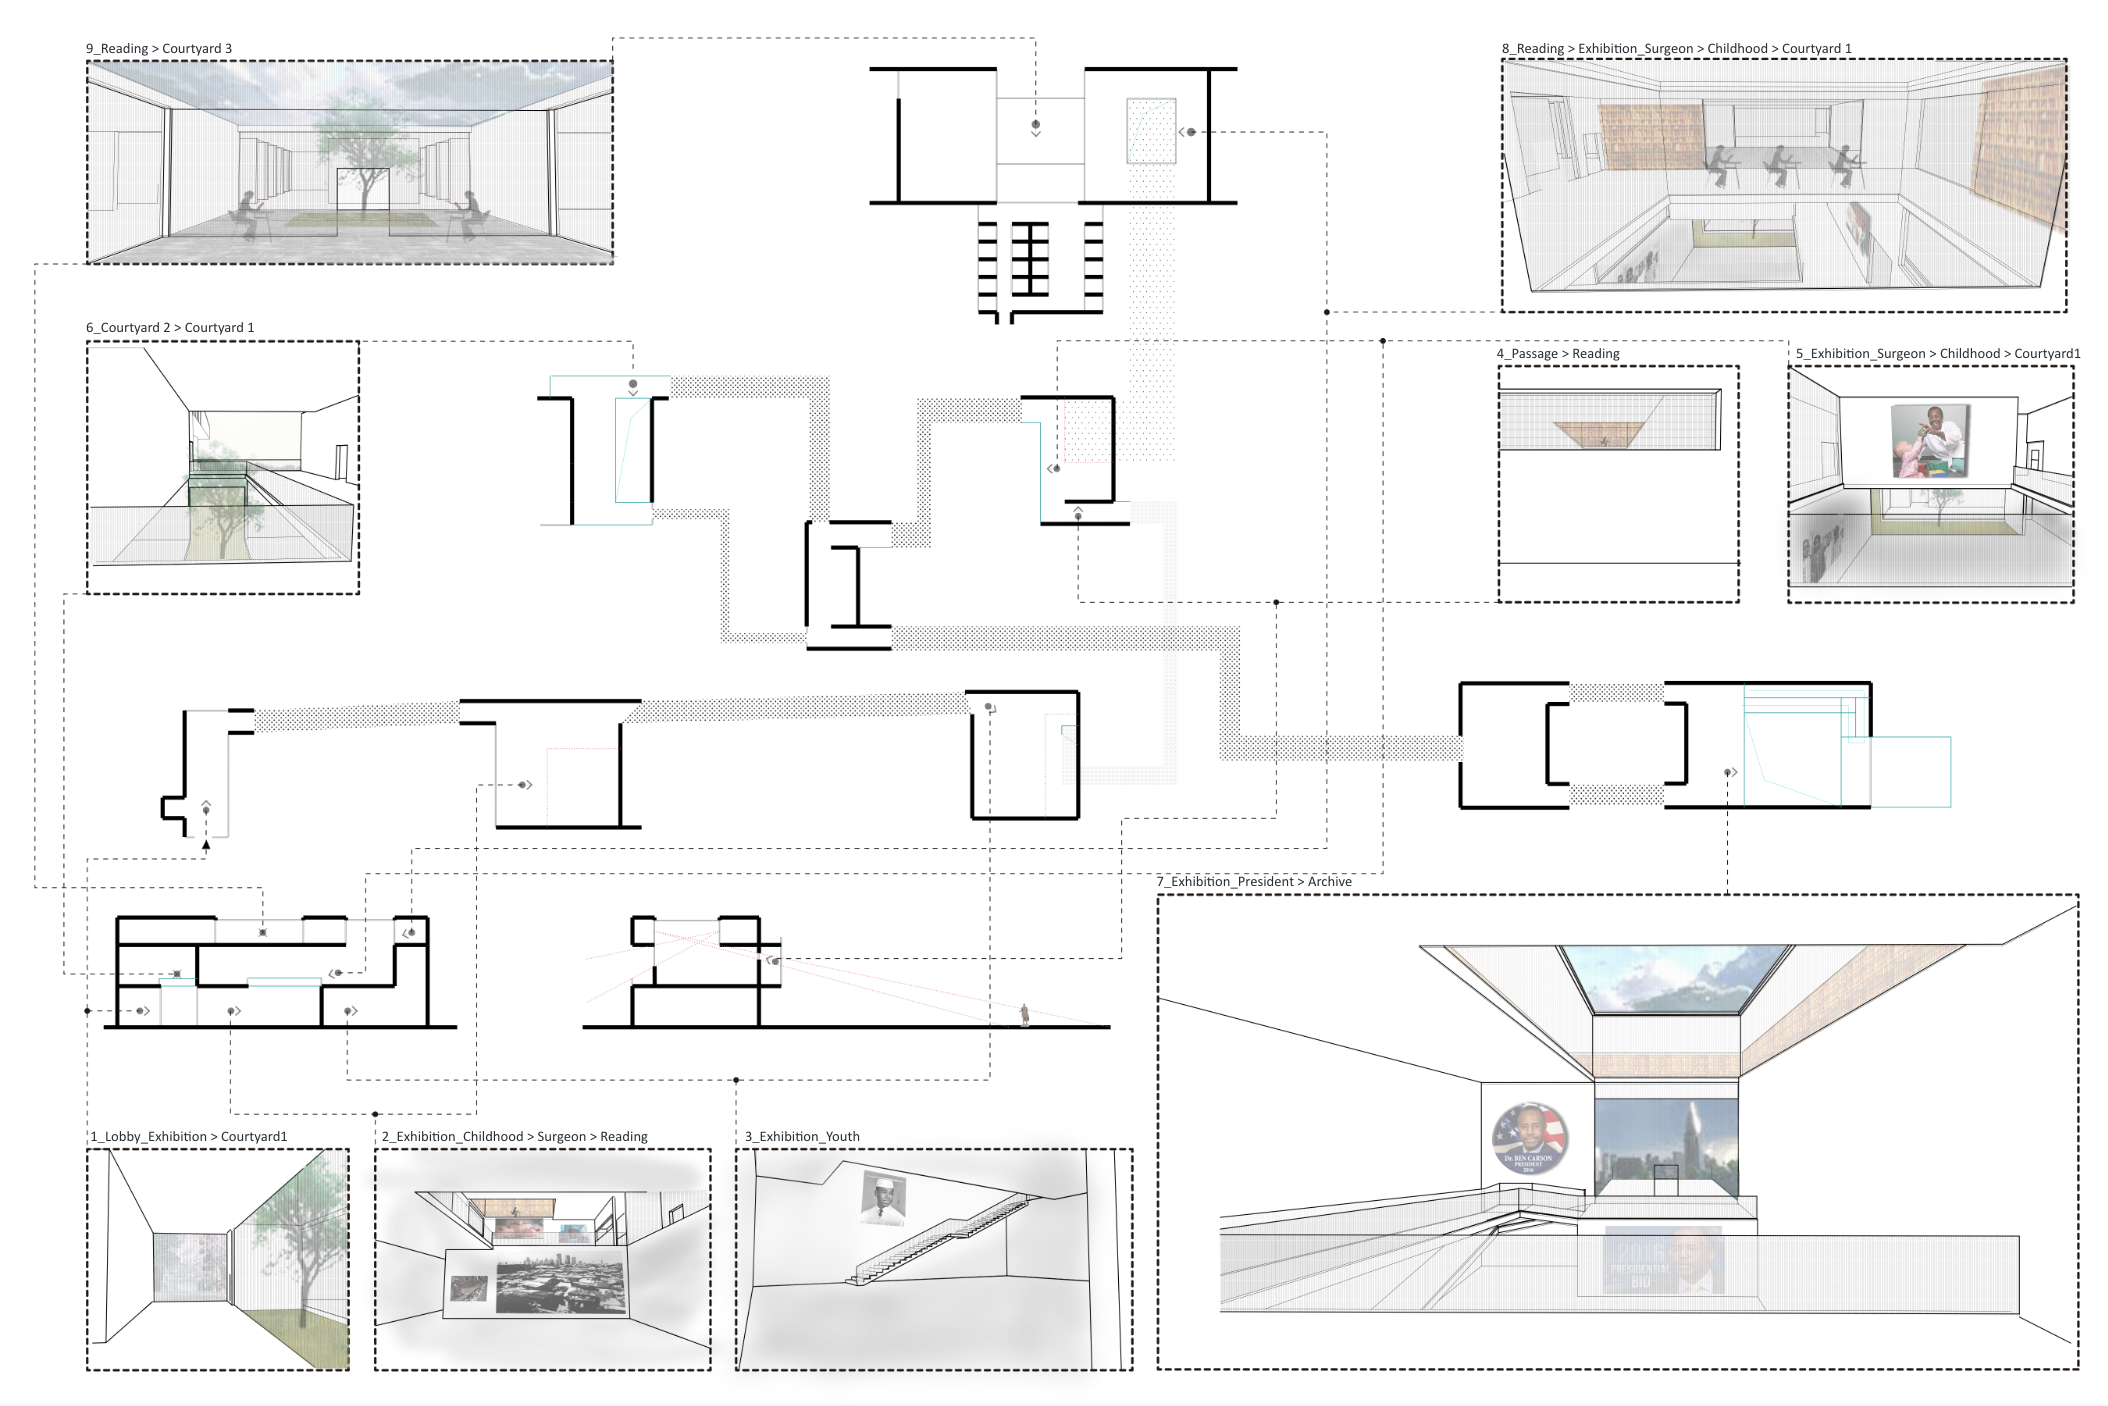
Before HCI, I was obsessed with Human-space Interaction
I diagrammed to inspect all types of spaces to scrutinize the experience of people inside or nearby.
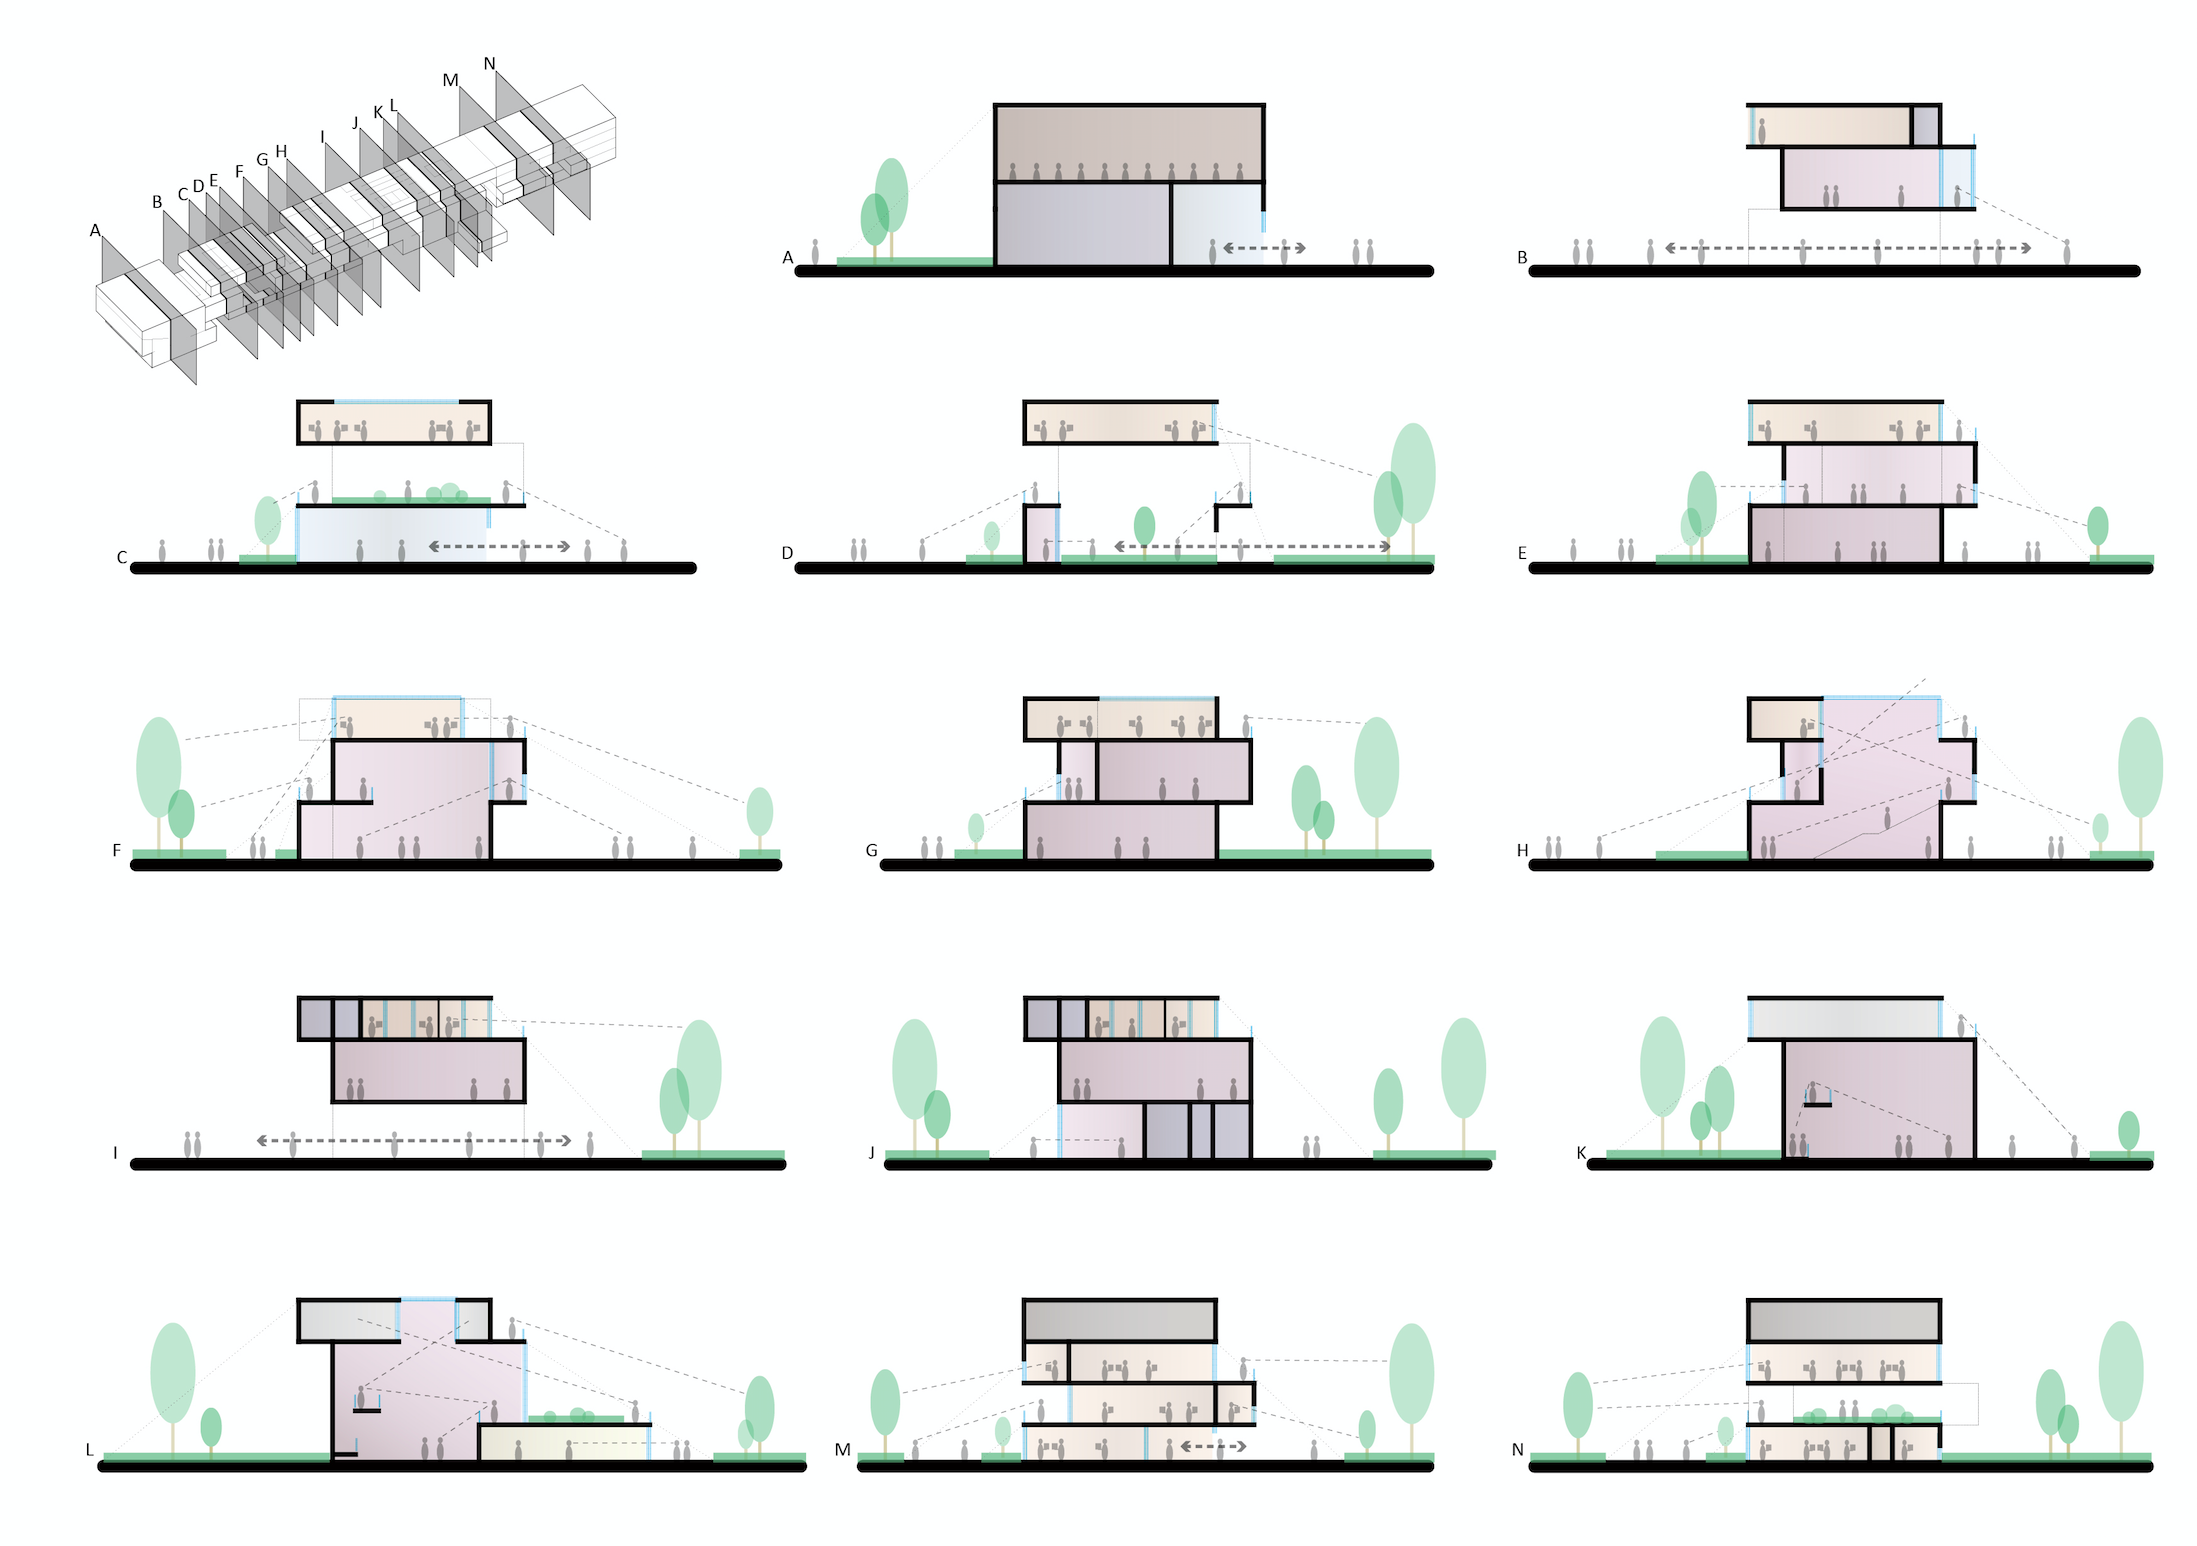
I created this diagram to efficiently inspect user flow, plan, space, and light design
simultaneously for potentials of optimization.
My imagination drove me to created a Fantasy on Post-apocalypse Organic Architecture
I began with the questions:
Where can we live after a nuclear apocalypse? How will we make use of the substances?
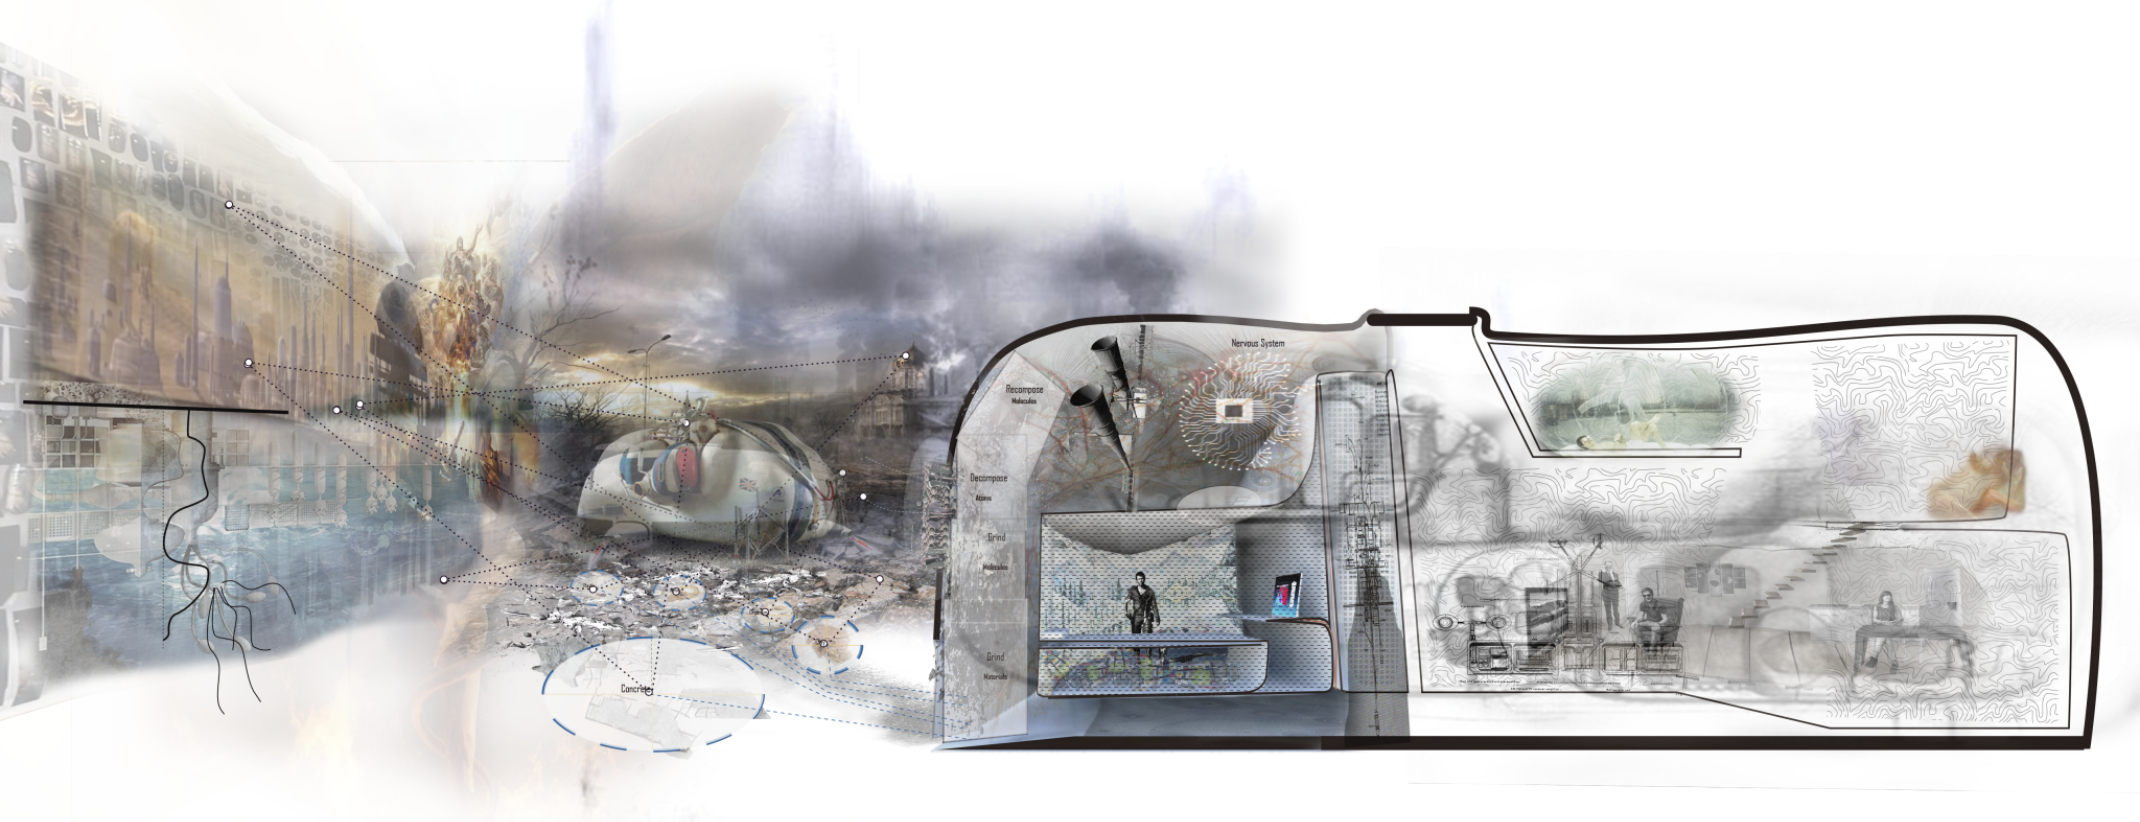
We can live in a shelter that simulates any environment we want!
The shelter can "eat" post-war debris to convert substances.
I tried to invision the whole manufacture system before the Doomsday with this diagram.
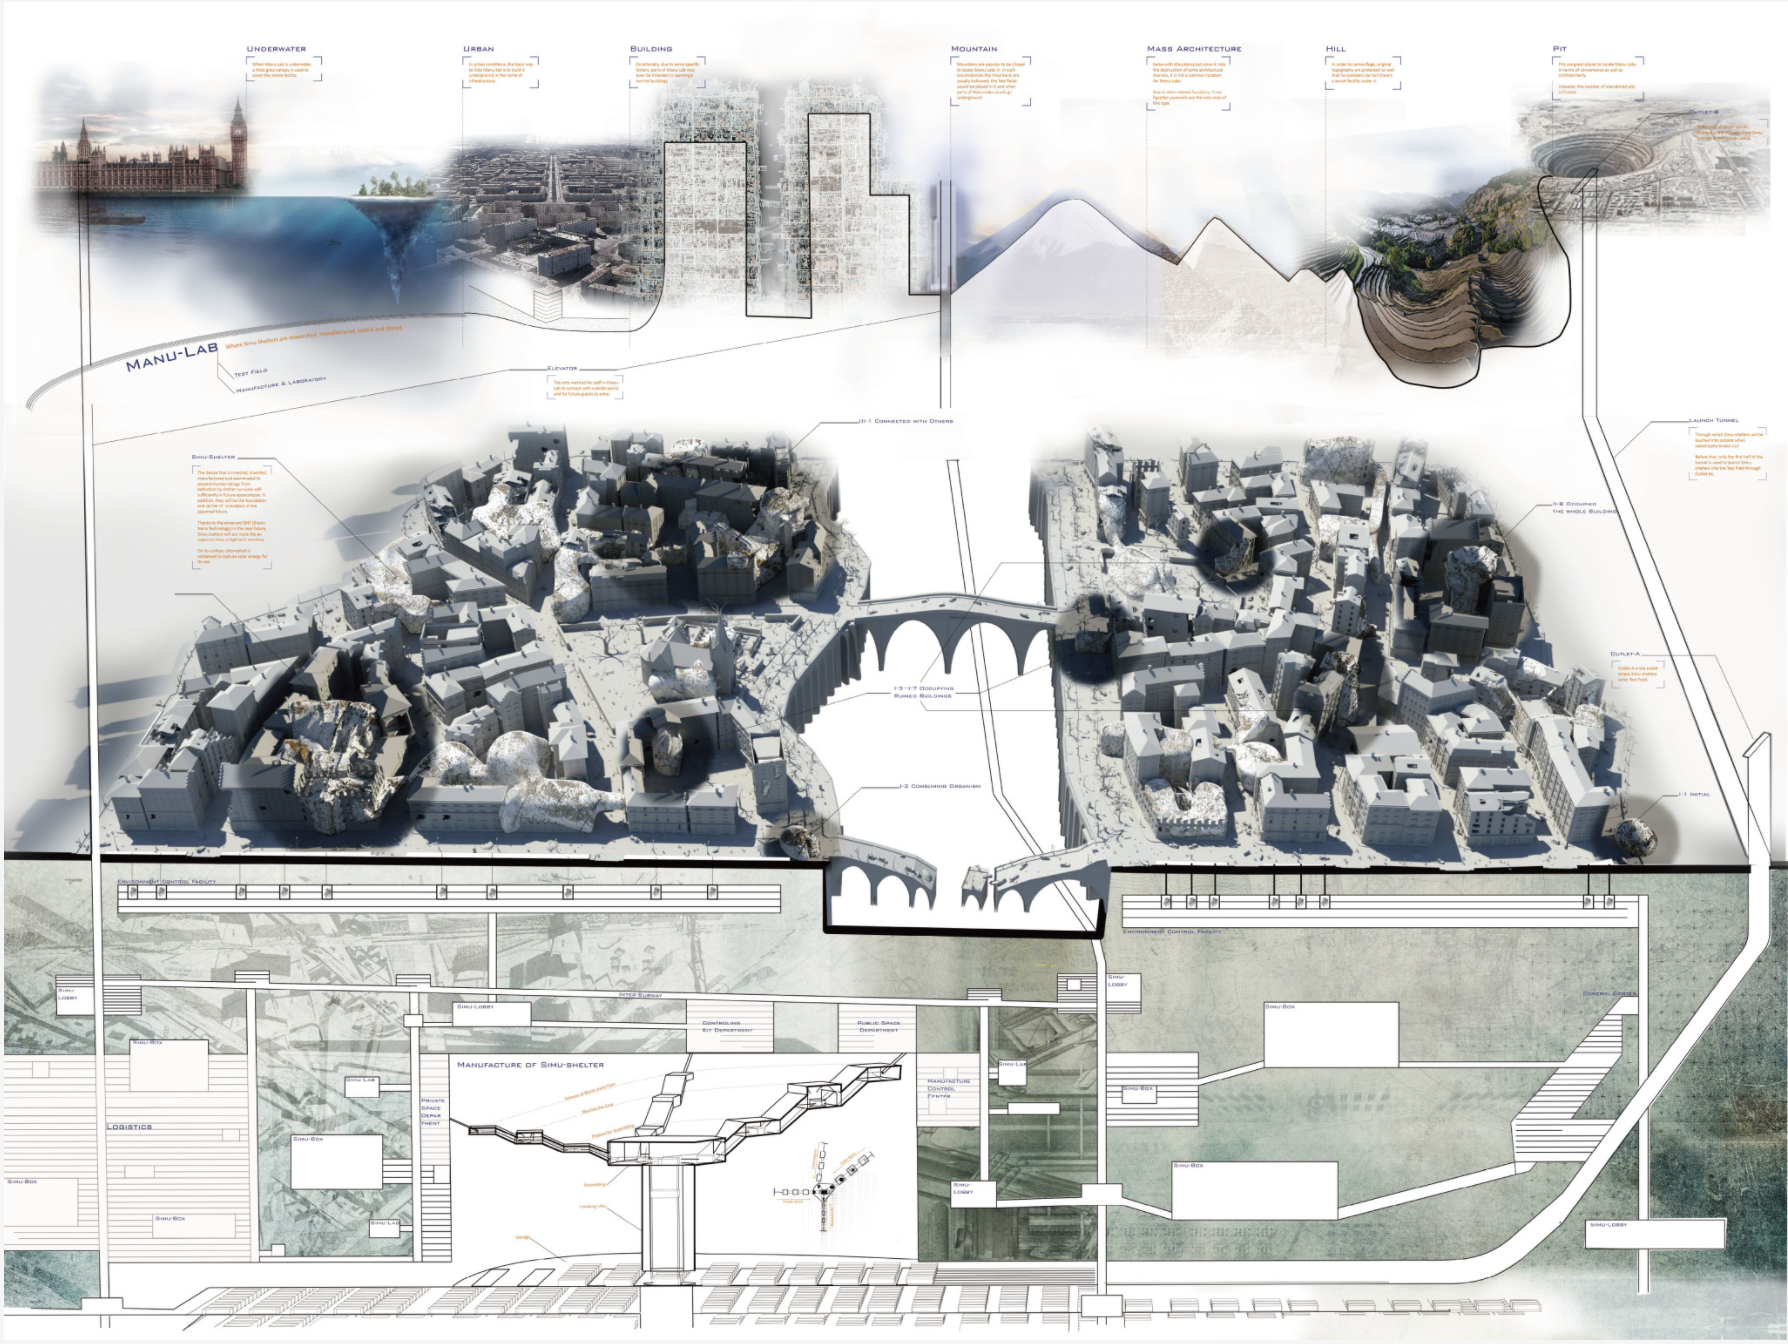
We start to do research and experiments, and finally manufacture them.
Everything happens in secret under any kind of location.
The chosen ones get onboard when The Disaster happens.
The shelters get launched and distributed on the surface afterward.
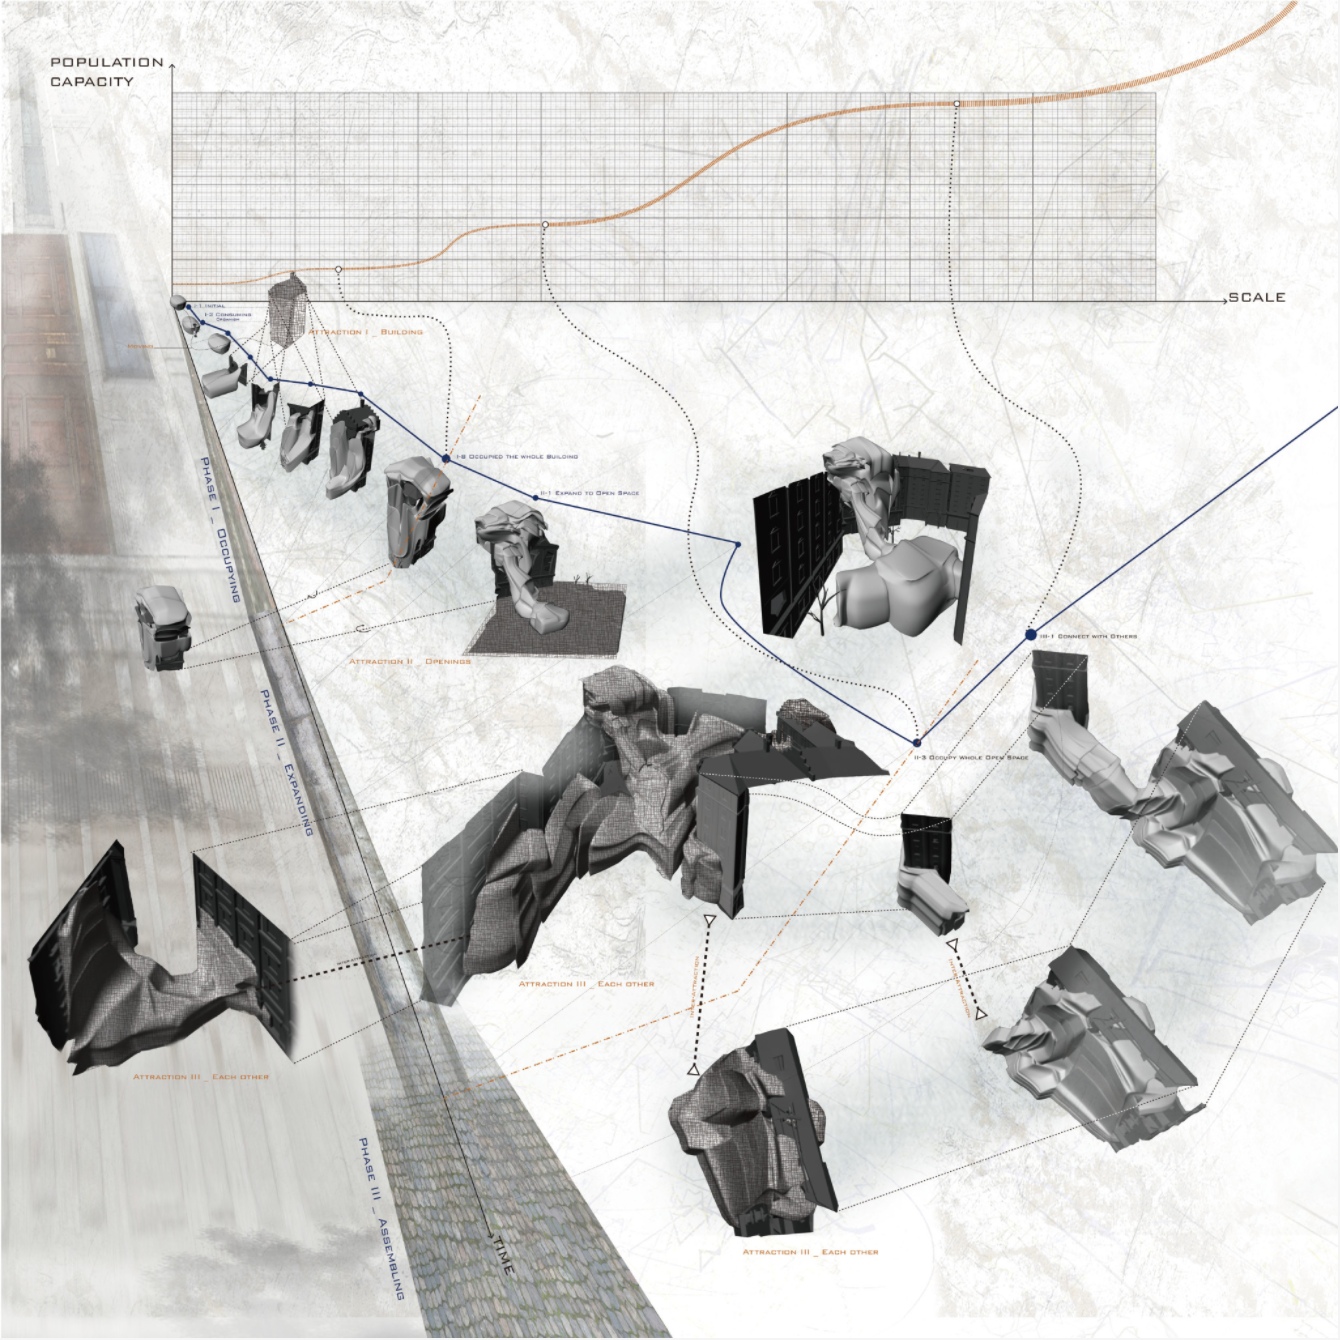
I mapped out the process of how a Simu-shelter "grows".
I created this Anatomy Diagram to design the Shelter system in more detail.
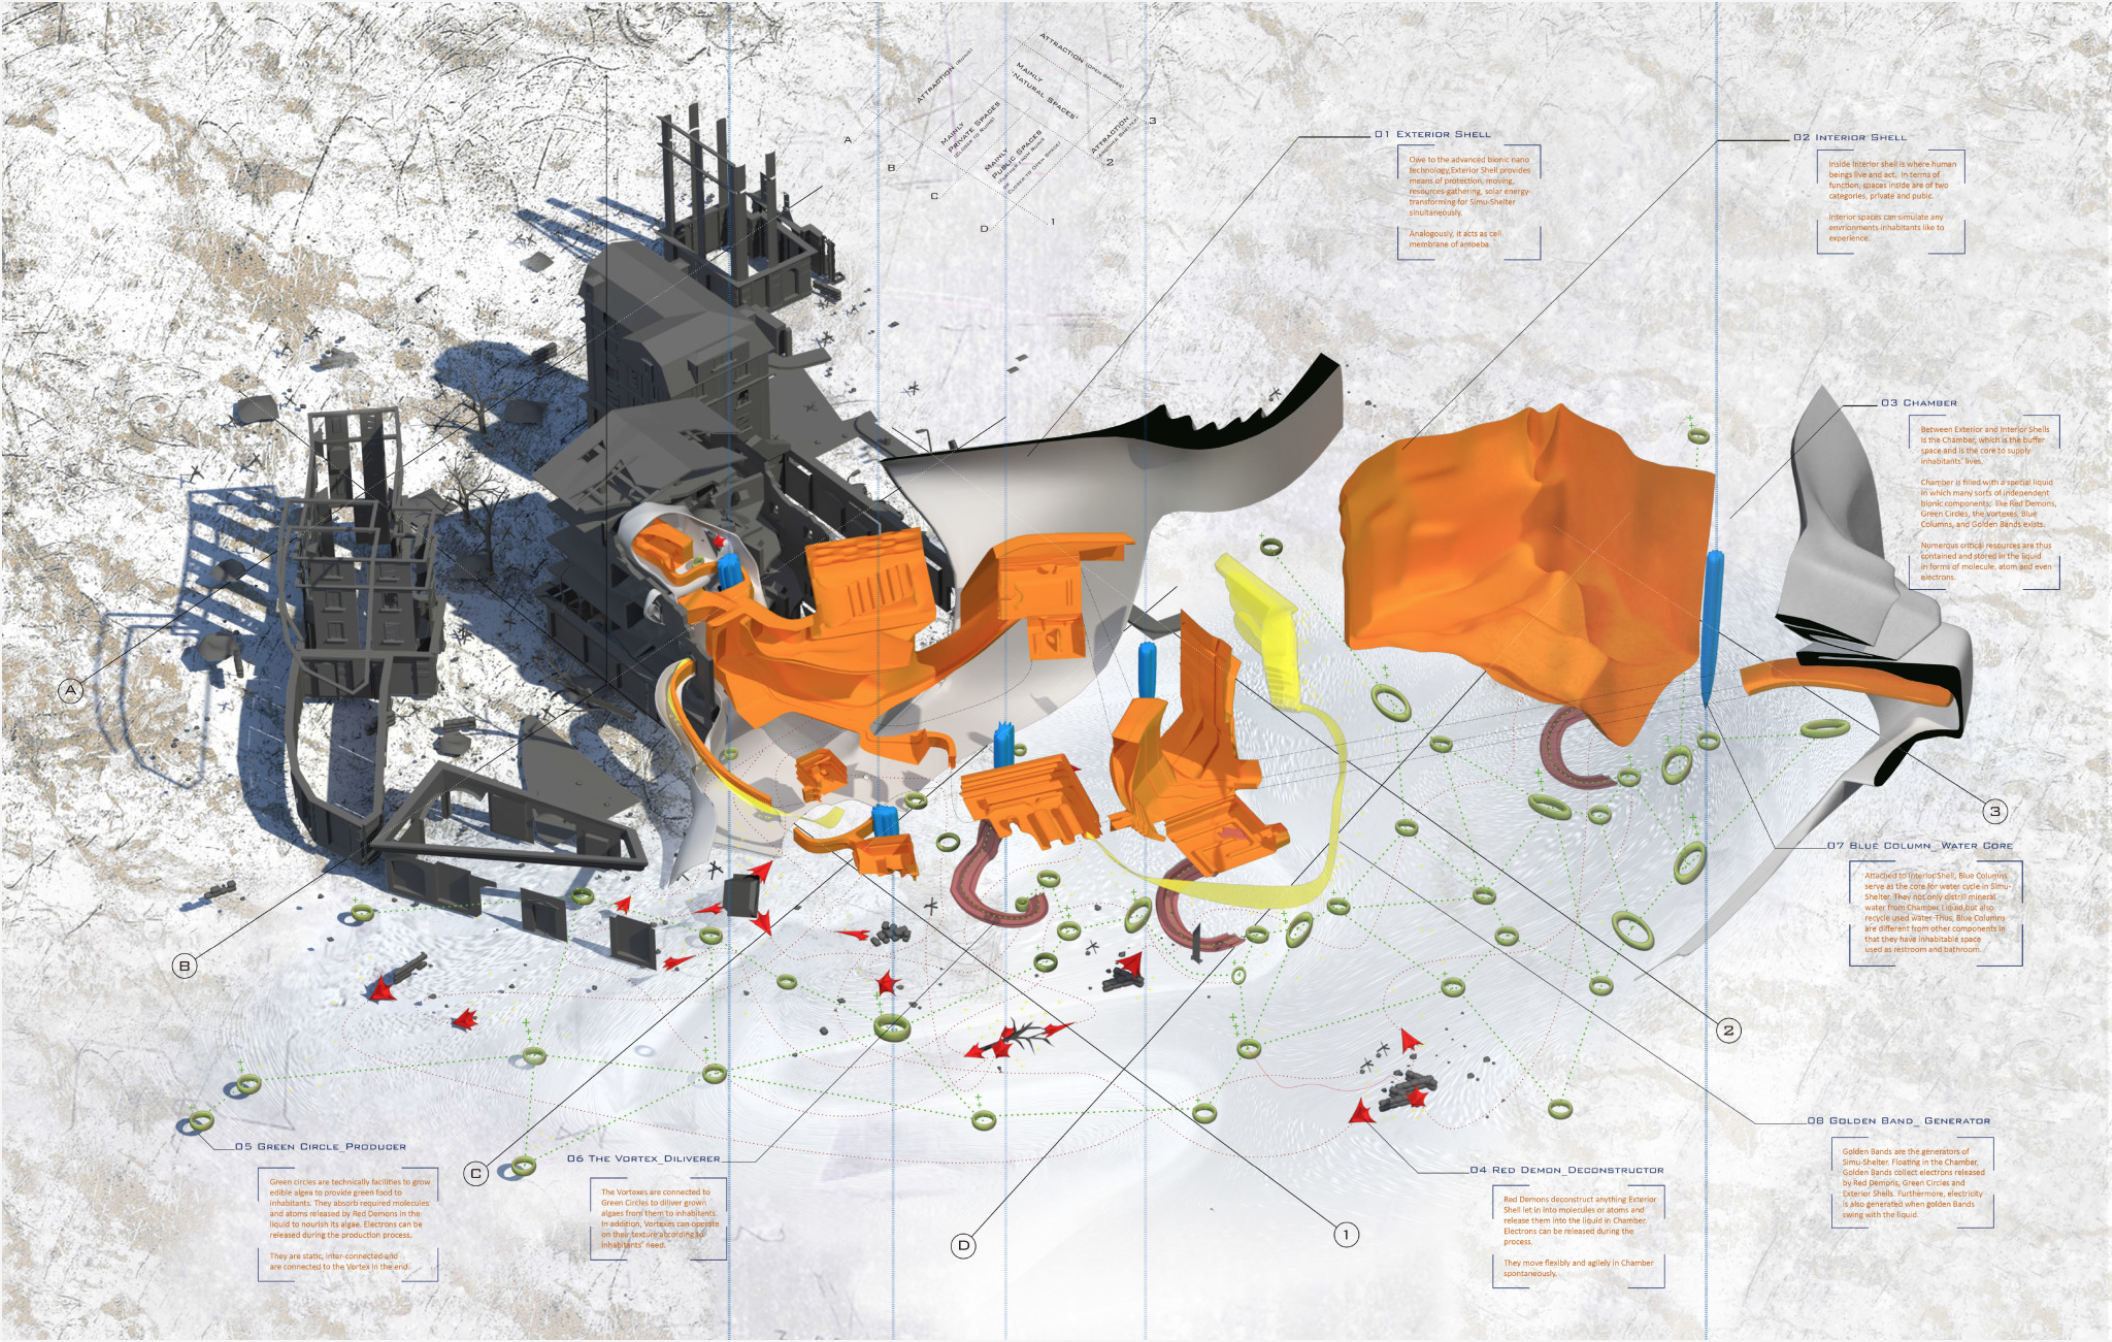
Aside from the cavities for human-beings, it also has different mitochondria-ish robots helping with sunstance-conversion and energy-transition.
I illustrated how residents reside in the Simu-shelter in an abstract manner.
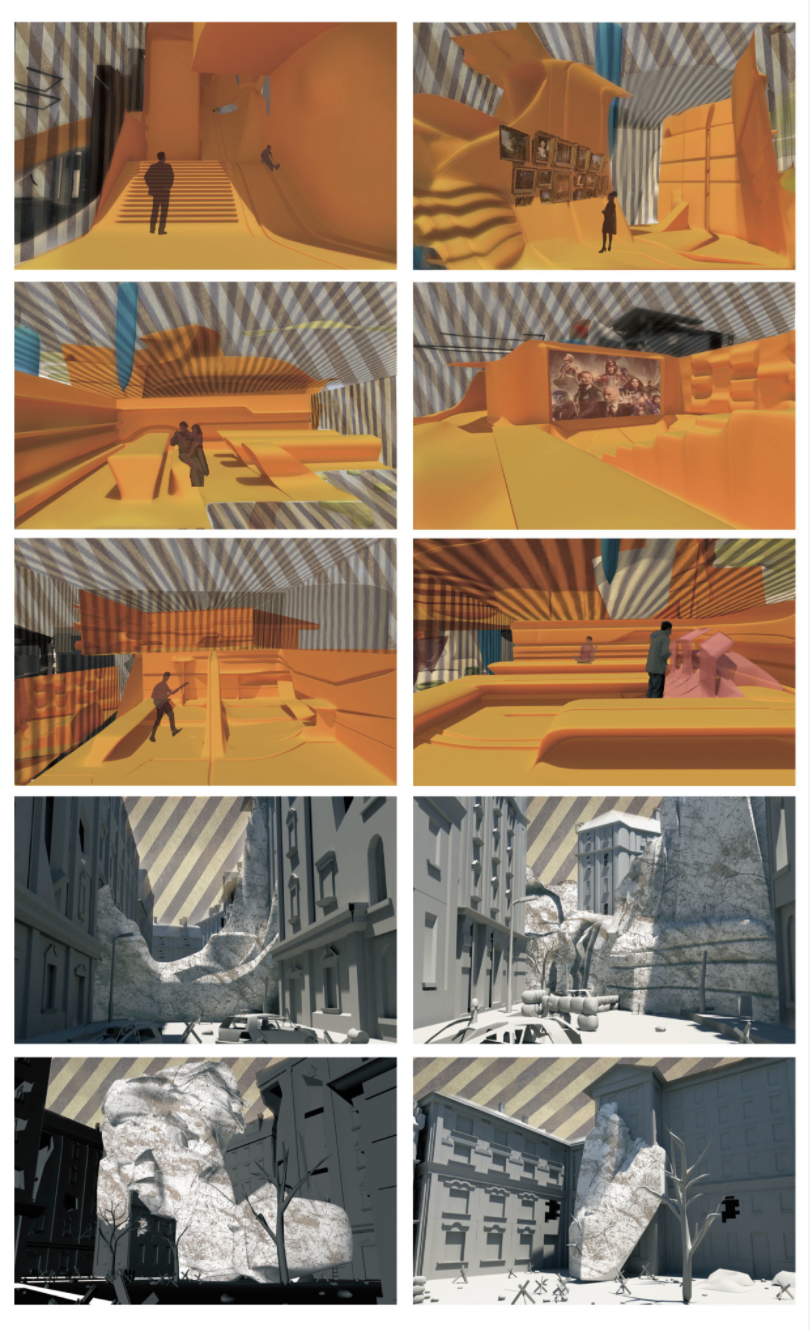
You are right, it looks so unreal!
But that's the point of a Fantasy, isn't it? ;D
CODING WITH FUN
I could not help learning coding for design better
By defining each interaction, I designed and implemented this program
to express fantastic momentaneous effects with simple interactions.
I started to visualize real data
Once upon a time in the world, Space Shuttles indicated our bright future as a civilization.
How far have they traveled?
It's long... I know... feel FREE to drag the video to the end :)
R.I.P, all staff members on Columbia and Challenger...
I became better in frontend coding and created tutorials
From a real dataset we visualized for the client,
I replaced the real data with the fake,
and showcased the data-vis process in the tutorial
I used the tech of WebVR to visualize data
This visualizes the results of the 2017-2018 Men's NCAA Basketball Tournament
where UMich ranked the 2nd!
It has information encoded in a 3D immersive space, which can be fun and cool.
BUT it does not make much sense for now in terms of efficiency... I mean, at least we should be able to shoot a basketball in it, right? :D